
Measuring Spring Football Fandom: A quick look at XFL and USFL 2023 Engagement Stats

The XFL and the USFL competed head to head for followership in 2023 for the first time. While we wait to see whether the merger will happen sooner or later, we thought a look back at how each league faired in that competition would give some good context for whatever decisions ultimately get made.
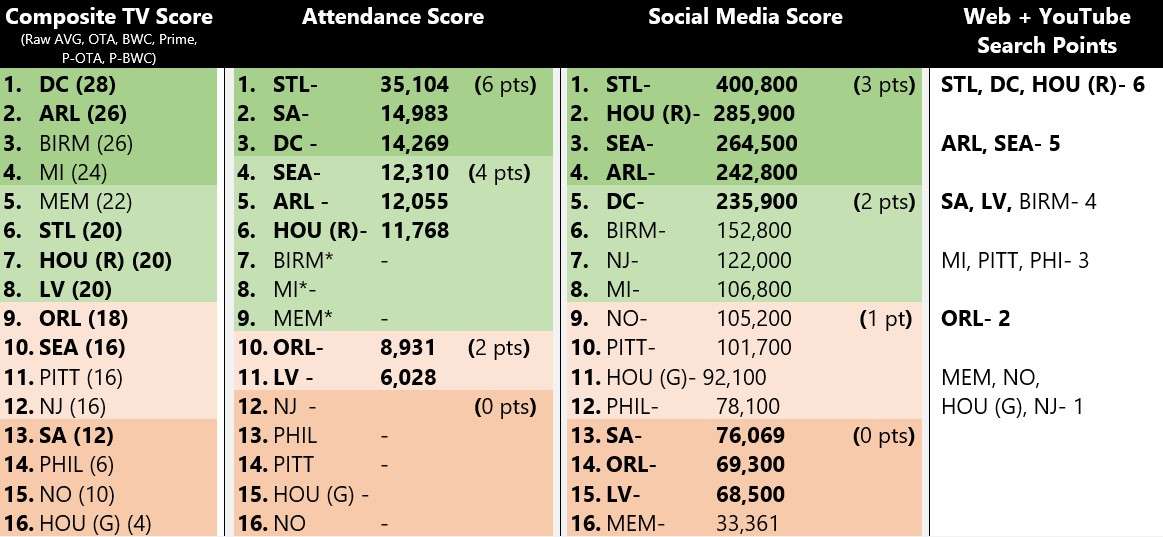
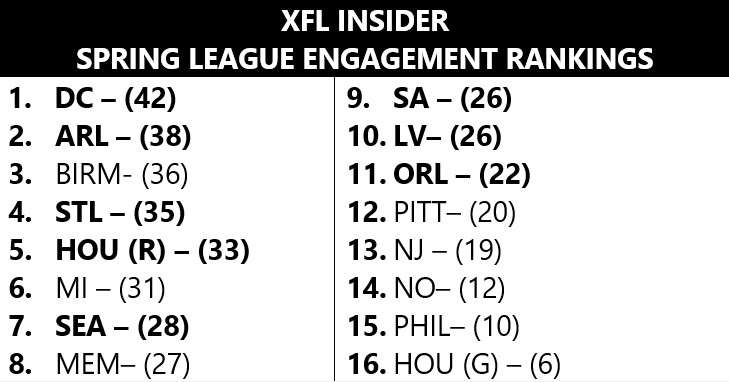
Before we get into it, here are my Spring League total engagement power rankings based on the data I was able to collect. Each team was given points for each part of a 9-part competition that consisted of Web/ YouTube searches, TV Viewership (broken into 6 parts), attendance figures, and total social media followings.
So let’s be clear, this isn’t about on-the-field play, or even merely popularity, but rather the overall strength of the team’s engagement as a brand in 2023.
XFL Insider Spring Football Engagement Rankings
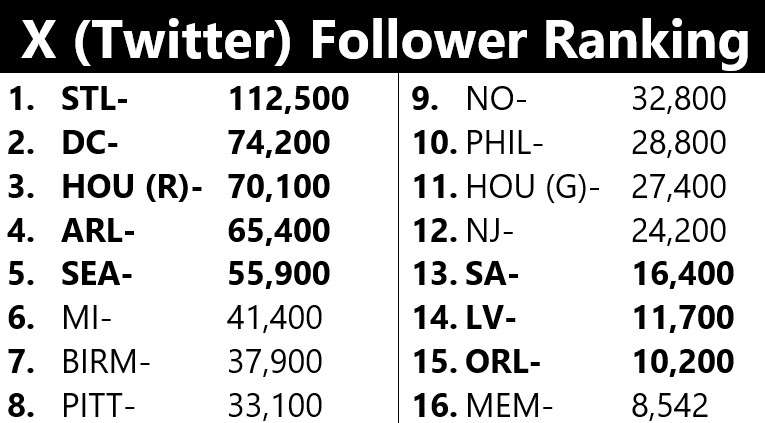
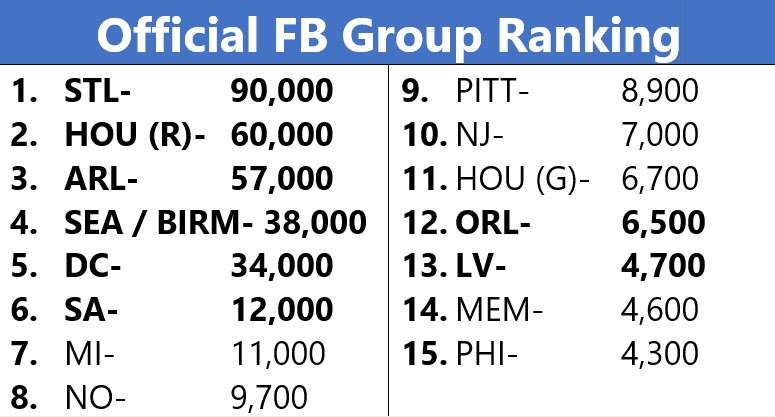
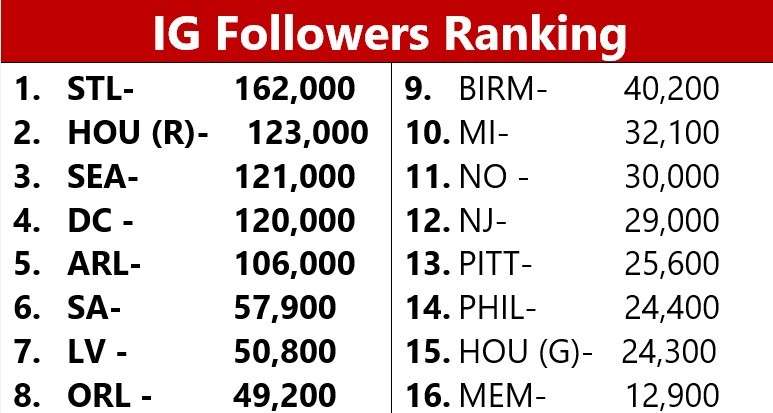
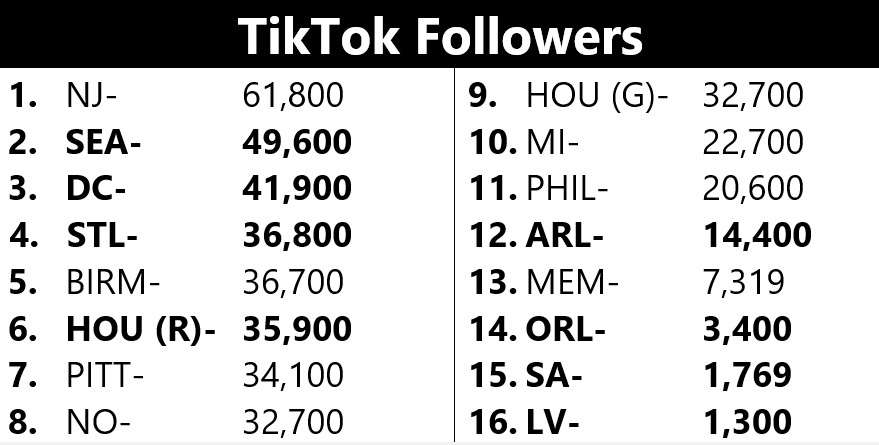
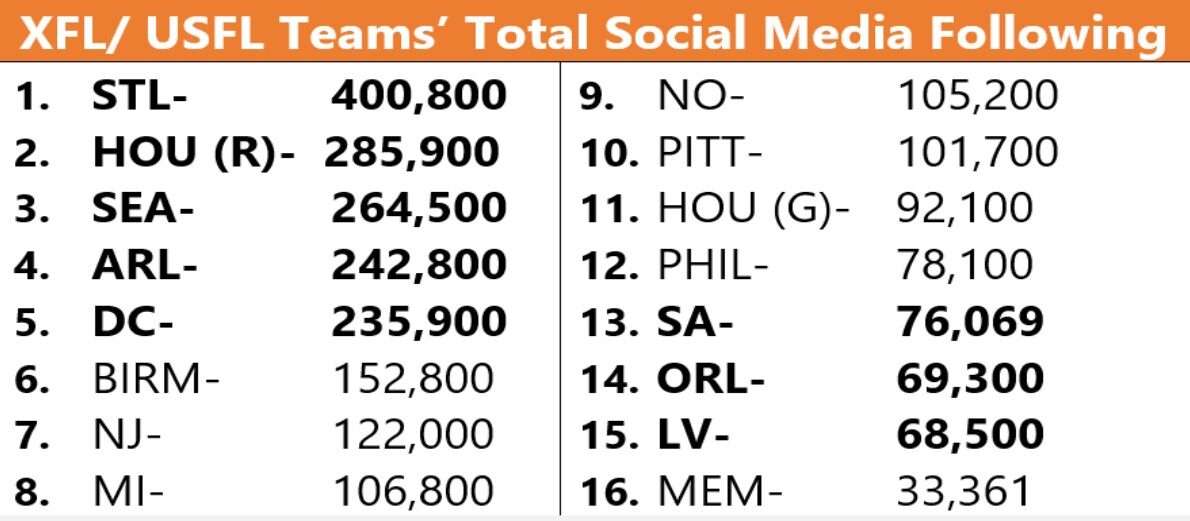
The charts below show how each leagues’ social media followings compare as of the date of this article.
The XFL leads on all major platforms. In general, it seems that the rankings are mostly due to the age of each league in the recent era. XFL 2020 teams are on top, USFL 2022 are in the middle, and the newest teams that began in 2023 are at the bottom. There’s obviously some truth to this, however this is not uniformly the case. For instance, all XFL teams are more popular on Instagram regardless of age, and 1st year San Antonio is more popular than all USFL teams on Facebook. New Jersey is the most popular Spring team on TikTok despite ranking around 10th or 12th otherwise. Birmingham is as popular as Seattle on Facebook despite starting after the Sea Dragons.
Altogether, the XFL teams have 1,407,069 total followers, and the USFL teams have 792,061.
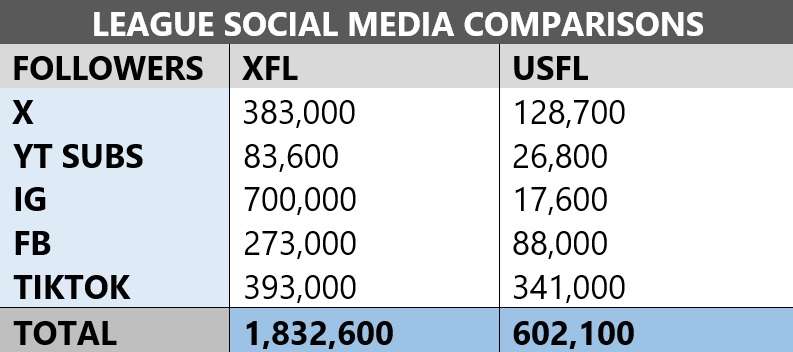
How each league’s main accounts compare.
The XFL’s main account has just over 3 times the following overall with its largest difference on Instagram. The two leagues are closer on TikTok.
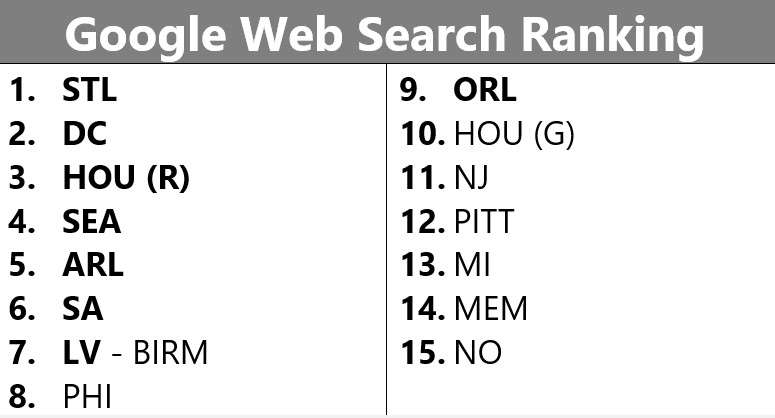
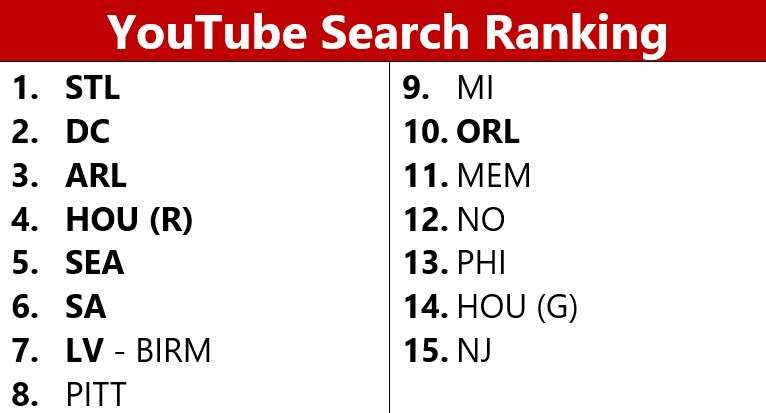
Web and YouTube rankings according to Google Trends.
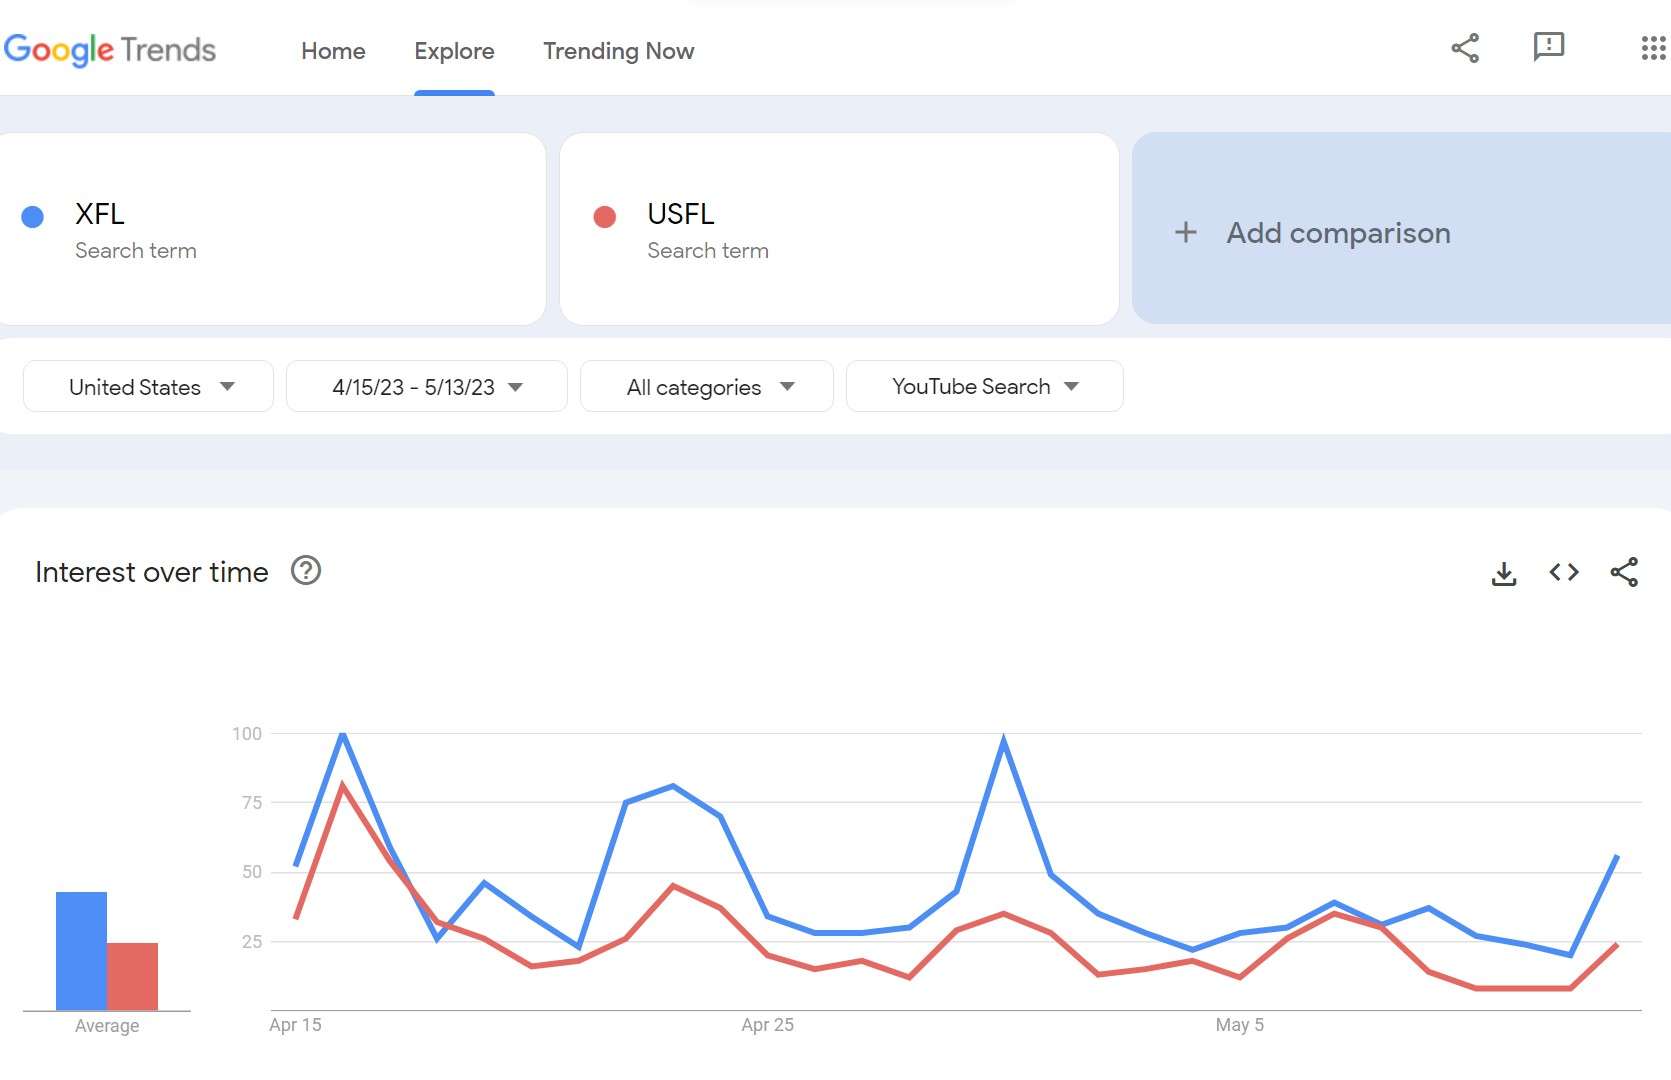
Some examples of search comparisons from Google Trends.
Google Trends allows you to compare the search interest for a given set of search criteria (i.e. words, products, brands, etc.). Most of the searches were filtered for the past 12 months.
Note: The XFL season ran from Feb 18 – May 13. The USFL season ran from Apr 15 – Jul 1.
Comparisons of league-related terms commonly search.
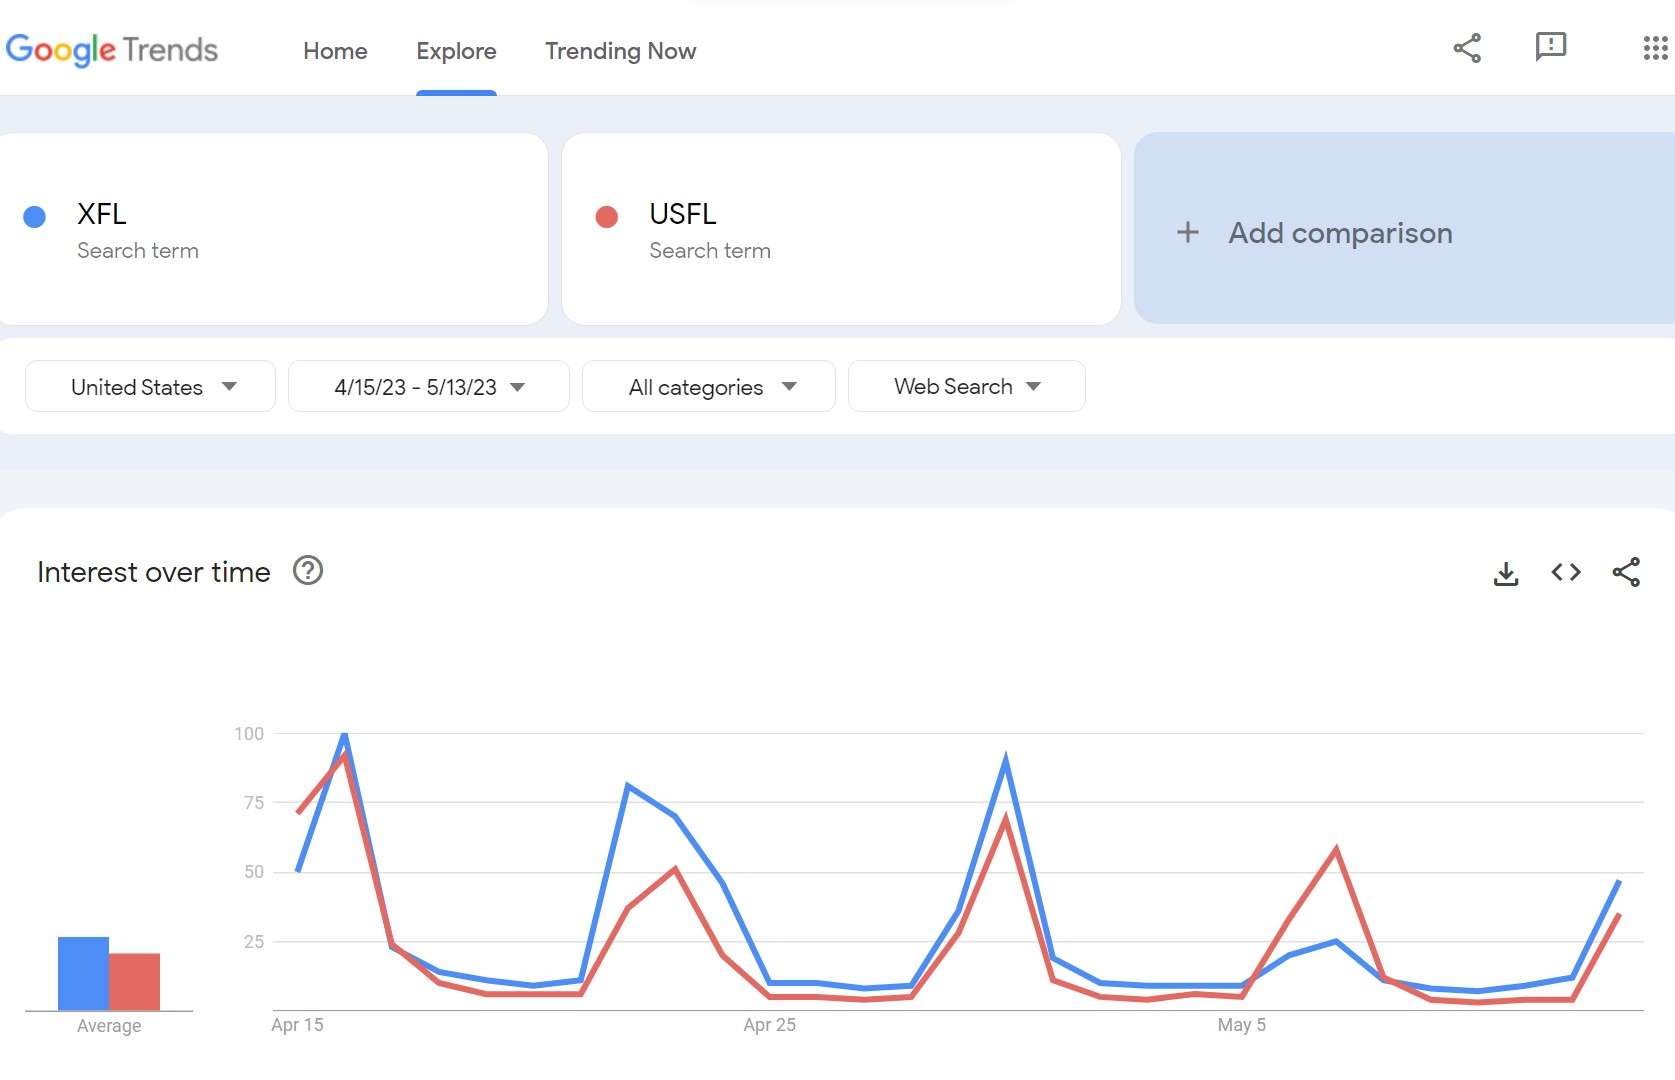
Web and YouTube search comparisons during the leagues’ overlap period (April 15- May 13).
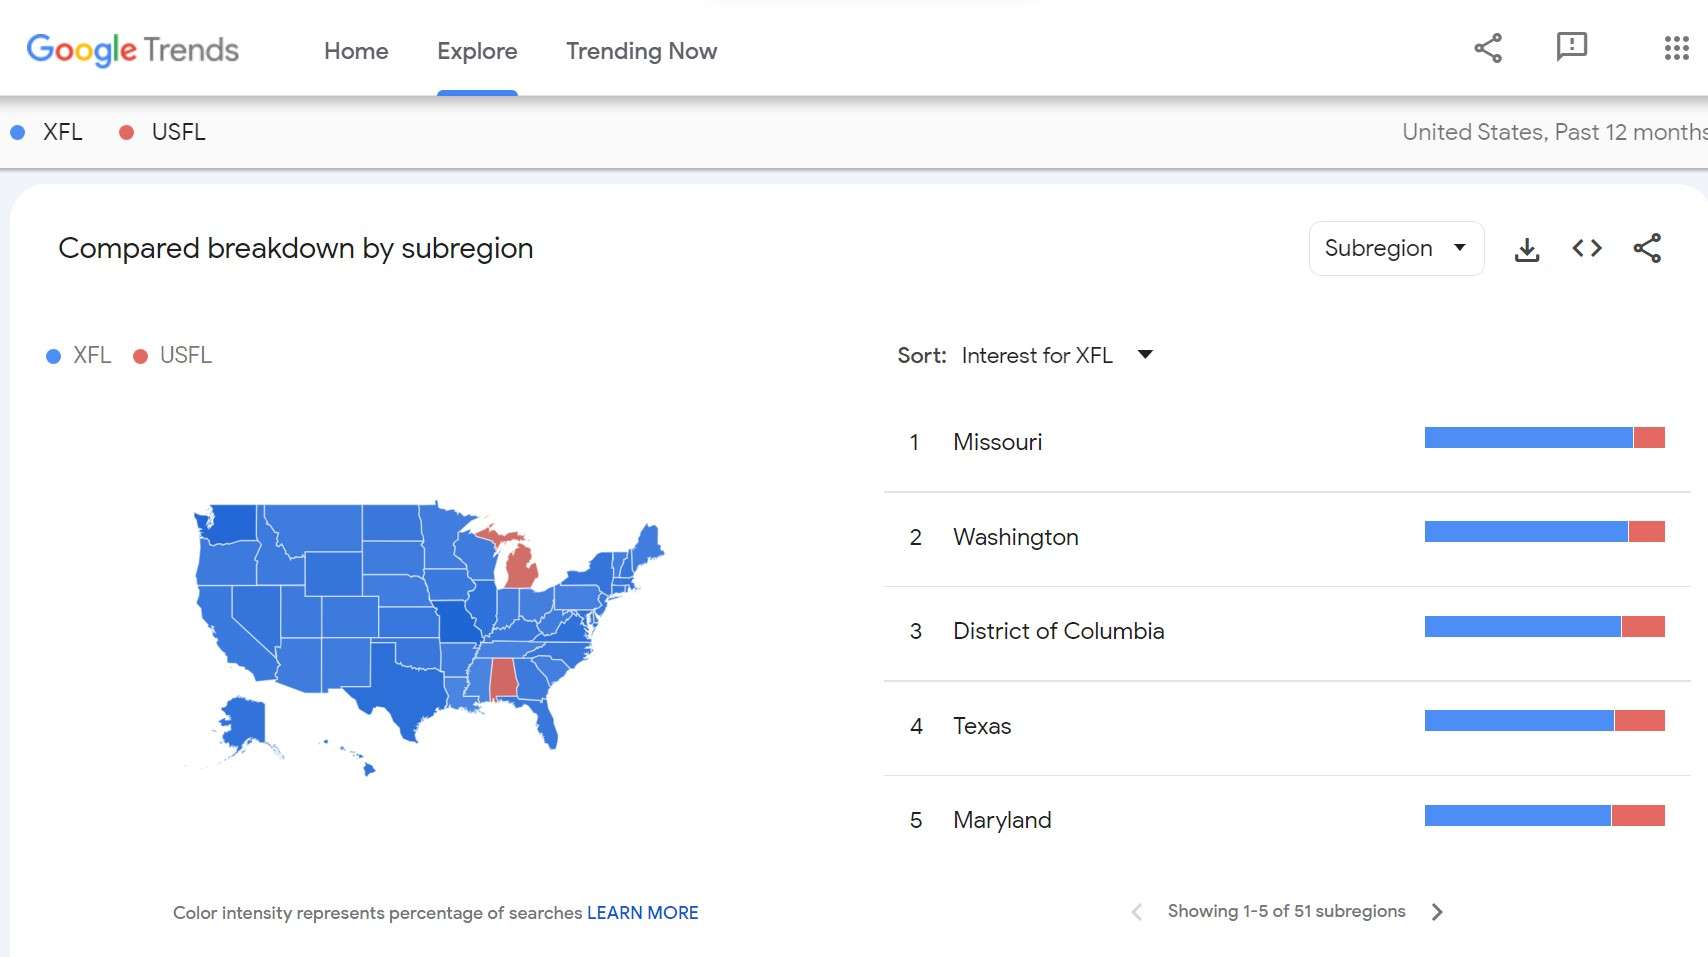
Map of search popularity.
The USFL was only more searched than the XFL in Michigan and Alabama. By the way, could Michigan be a sleeper to overtake Birmingham in a couple of years as the center of USFL football fandom as long as the team plays well….I think so!
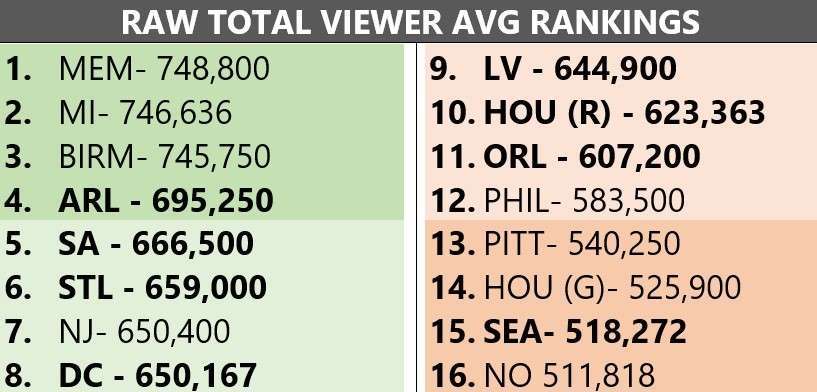
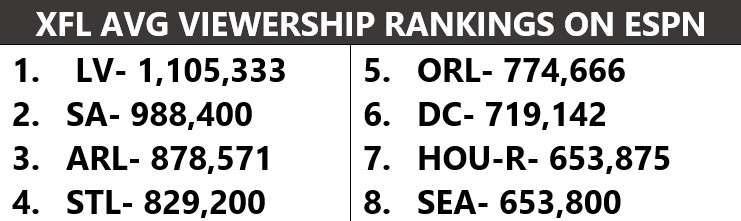
Viewership averages based on available data.
Viewership numbers are influenced by many factors, the biggest of which is distribution type, i.e. whether the game is on over-the-air (OTA), ESPN, or on cable channels other than regular ESPN (which I like to call “Bad Weather Channels (BWCs),” because, like in a real game, it’s harder to get a win in that situation).
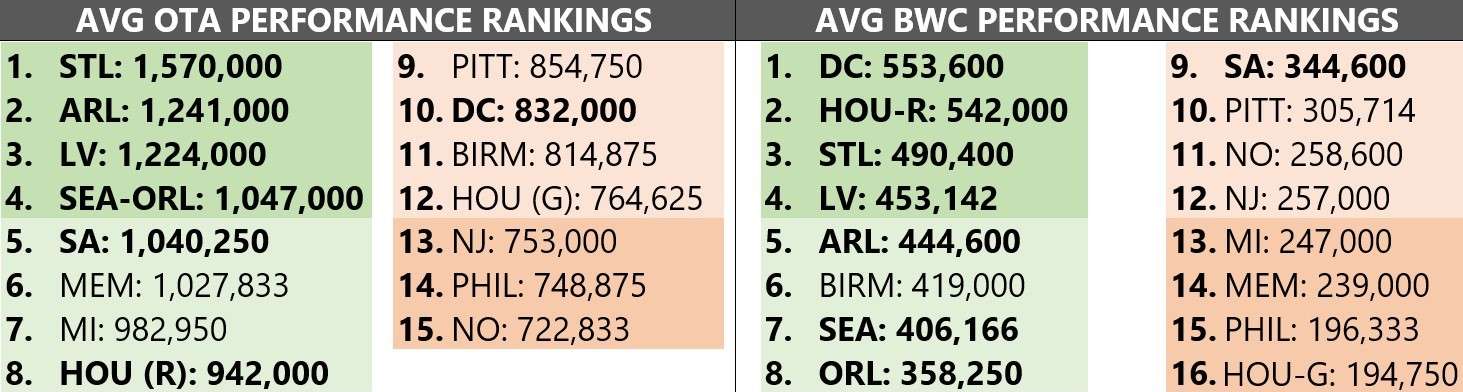
To compare “apples to apples,” we have to disaggregate for the distribution types the leagues had in common. We then looked at the average OTA viewership, and the average viewership on BWCs, to see how those compared to the overall picture.
For context, the middle of the XFL season competed with March Madness, MLB regular season, the NHL playoffs, and latter part with the beginning of the USFL season. The USFL season competed with the XFL regular season and playoffs, the MLB regular season, and NBA playoffs. Those factors will obviously influence the viewership of a particular weekend.
Observations:
- No team averaged under 700,000 for total OTA average. No team average above 600,000 on BWCs.
- The USFL has the top 3 teams in terms of total viewer average. XFL teams lead in OTA and BWC performance.
- There is a big gap between USFL teams’ performance on OTA and BWCs.
- LV ratings compare more favorably than you might expect given their poor record and venue. The Vipers had the highest rating on ESPN of all teams, and were stronger on BWCs than half of the XFL.
- Hub teams are generally comparatively weaker performers than all other Spring teams. LV and ORL still out-performed half of the USFL (all hub teams except NJ) in total viewing average, despite being the weakest XFL teams in record and attendance, and despite having less favorable TV distribution overall.
- While the previous fact is true, the NJ Generals were still in 4 games in which they were the most, or 2nd most, watched game for their opponent. On the other hand, the Pittsburgh Maulers were in 6 games where they were the least, or 2nd least, watched game for their opponent. Two of those games were against NJ.
- The Houston Roughnecks are clearly the more popular Houston team. On BWC alone they had a better average viewership than the Houston Gamblers did overall, even with their OTA games included. The Roughnecks also did not have the benefit of OTA primetime games, while the Gamblers’ primetime games were ONLY on OTA networks.
- The two Houston Gamblers vs New Orleans Breakers games both drew less than 200,000 viewers.
- Cities bigger than Birmingham that played in their home markets all did better OTA than Birmingham, however, Birmingham did better than all bigger cities that played in hubs (except Pittsburgh).
- The USFL had the most viewed Spring game (MI vs MEM), but also the least viewed (HOU-G vs NO).
Differences in TV distribution
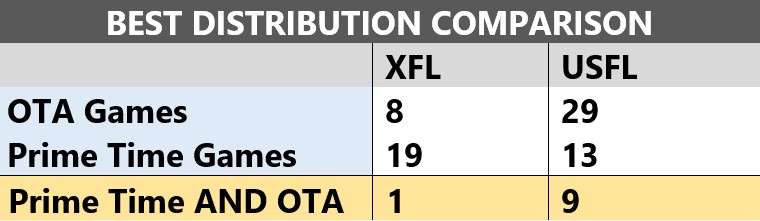
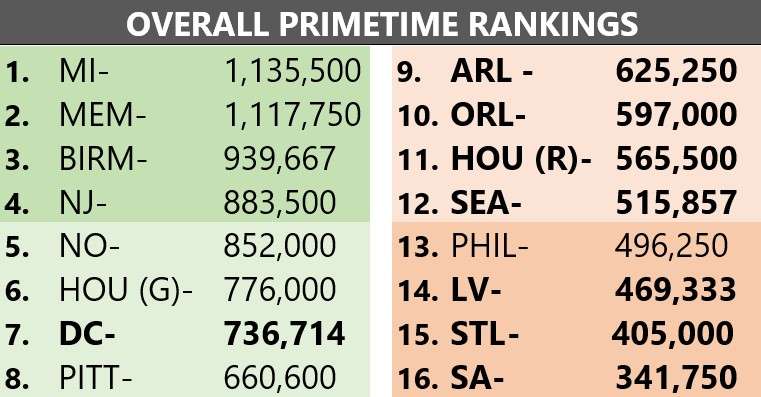
We also looked solely at primetime viewer averages and broke them down in the same way. The best exposure for a game is on OTA or in primetime slots, with the absolute best being a combination of those two. Here’s how that broke down by league.
- The XFL had 20 games on BWCs, the USFL had 16.
- The XFL had 15 games on ESPN.
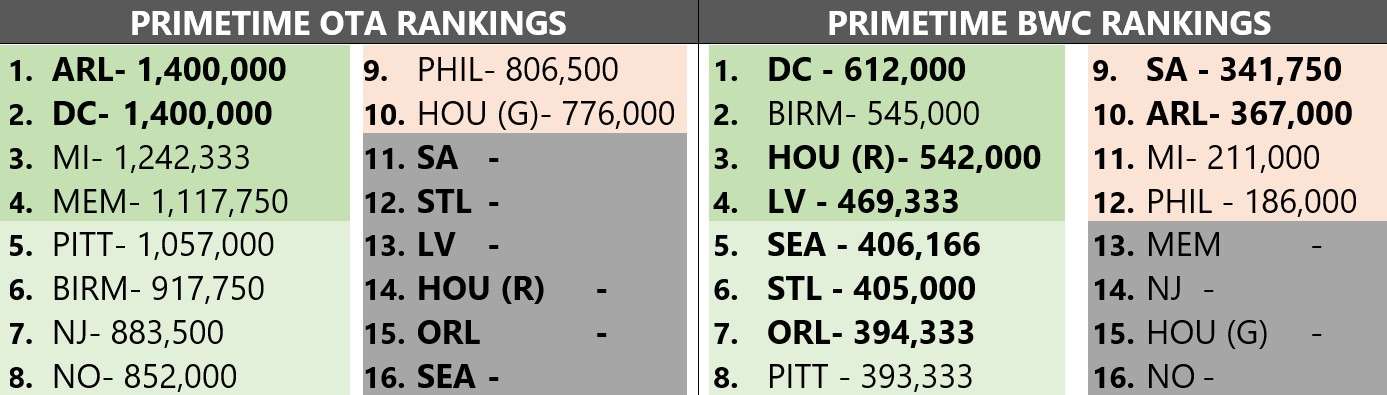
The USFL’s strongest advantage was definitely in OTA and primetime distribution with the first XFL team not appearing until 7th place. Besides the championship game, the XFL did not have any OTA games during primetime, and instead had all primetime games on cable. On the other hand, the USFL had most of its primetime games on OTA, and 4 of its teams never had any primetime games on BWCs.
Also, FOX and NBC were able to use other events on their networks as lead-ins to boost some ratings. For instance, due to a lead-in from the Kentucky Derby the Michigan vs Memphis game in Week 4 garnered 2.06 million despite neither team otherwise having a game over a million viewers.
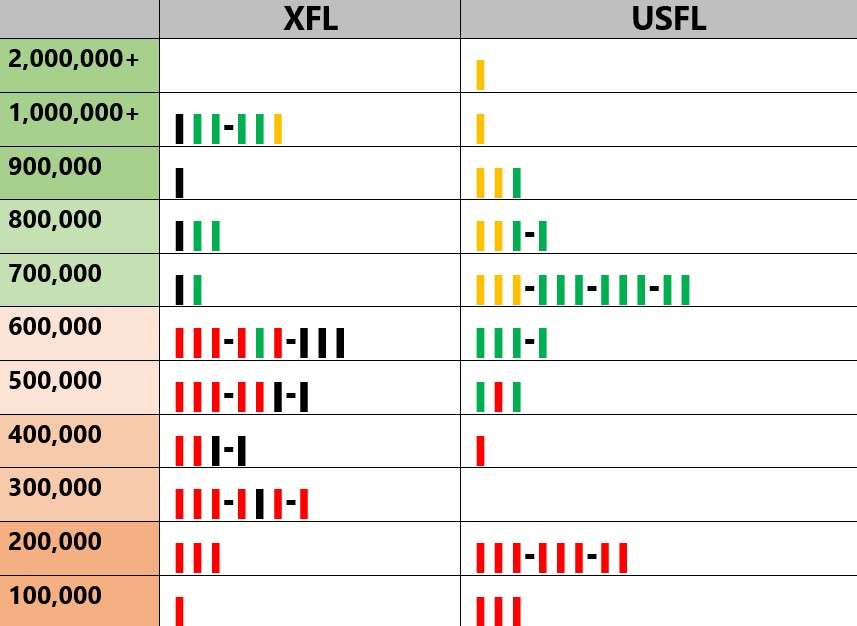
Below is a visual representation of the viewership distribution per 100,000 viewers.
OTA
Primetime OTA
BWC
Regular ESPN
From the chart we can see a few details (each tally represents a game).
The XFL’s ratings were more evenly distributed while the USFL either had decent ratings (clustering in the 700,000’s) or very bad ones (clustering in the 200,000’s or less). The USFL had 11 games with less than 300,000 viewers (all on BWCs).
The XFL had more games over a million, but fewer games in the 700,000 to 900,000 range.
The XFL had a higher ceiling on BWCs (in the 600,000’s). The USFL had a lower floor on OTA (in the 500,000’s).
The XFL’s viewership on ESPN spanned the entire spectrum and was not necessarily always a guarantee of higher or lower ratings. The median range for XFL viewership on ESPN would be somewhere in the 600,000s.
Here’s the Spring Football ranking breakdown based on the points each team received in each comparison.
Each team was tiered for each aspect we looked at and given points for their tier. Social media and web/ YouTube rankings were worth half of those for viewers and attendance.
- Tier 1= 6 pts; 3 pts
- Tier 2= 4 pts; 2 pts
- Tier 3= 2 pts; 1 pt
- Tier 4= 0 pts
Taking all stats together DC ends up on top, but that doesn’t mean they win in every aspect, or that they are the overall most popular team per se. It simply points out that they performed the best when all categories are added together. Of course, the more popular the team the higher they will rank, because popularity is indeed a factor in engagement. Nevertheless, the rankings shouldn’t be seen simply as popularity indicators, but rather of the power of a team to engage the market overall.
For instance, STL is hands down the most popular Spring team on the internet, and in attendance, but that popularity did not automatically carry over to other aspects (i.e. they were 6th in total viewership, 6th in primetime BWC performance, 15th in overall primetime average, and had no primetime OTA games at all). DC on the other hand, performed less favorably than STL on the internet, but was also able to gain points in more impactful areas by ranking 2nd in primetime OTA performance, ranking 1st in overall BWC performance, and 1st in primetime BWC performance- areas where STL was weaker.
What actually matters more in these rankings is the tier or quarter a team lands in, which will show us the strongest, upper-middle, lower-middle, and weakest performing teams.
- Tier 1: DC, ARL, BIRM, STL.
- Tier 2: HOU (R), MI, SEA, MEM.
- Tier 3: SA, LV, ORL, PITT.
- Tier 4: NJ, NO, PHIL, HOU (G).
To error check my tiers I also ran the scoring based on an individualized scoring system rather than a tier-based one, and the ranks were identical. Tier 2 is the only tier where there could be some change because there are two USFL teams there whose attendance numbers are not available. So, presumably MI and MEM could hypothetically jump (or fall below) their respective neighbors if their attendance turned out to be better (or worse). So, in light of not having those official numbers, I believe their rankings are reasonable. Attendance numbers for BIRM are unlikely to change their ranking however.
If the Michigan Panthers’ attendance is equal to, or greater than that of the Orlando Guardians, they would jump the Houston Roughnecks. However, if it is equal to, or less than, Las Vegas they would fall below Seattle
If the Memphis Showboats’ attendance is greater than the Roughnecks, they would jump Seattle. If their attendance is equal to, or less than, that of Las Vegas, they would fall below San Antonio.
If the Birmingham Stallions’ average attendance is below that of Orlando’s they would fall below St. Louis. However, they would have to have an attendance average higher than St. Louis in order to jump the Renegades.
How can we chart the growth of Spring football?
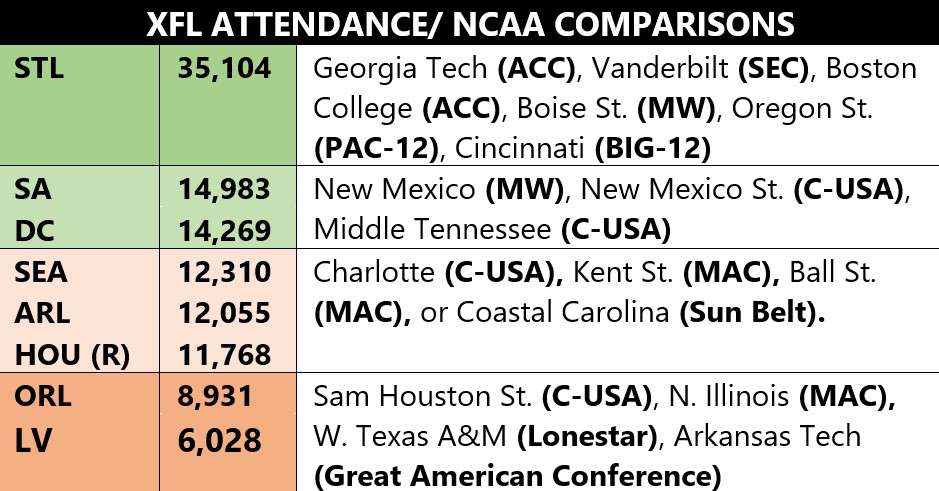
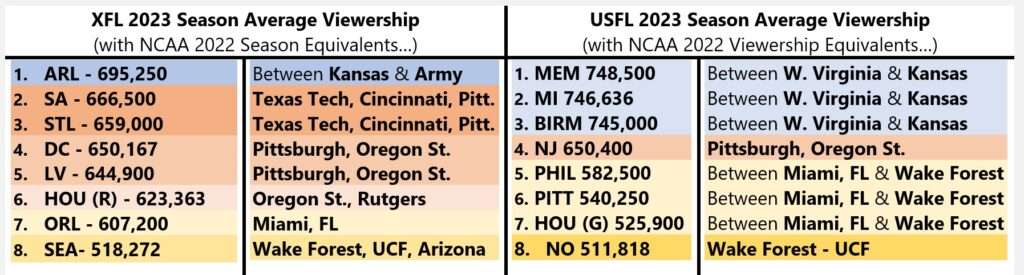
Well, here’s how Spring football games can be seen as compared to NCAA football viewership and attendance. Comparing Spring Football to NCAA football can be a useful measuring tool since NCAA programs can range from extremely small and obscure schools to large and extremely popular traditional powers. Because of this, it can be used to measure the growth of the league over time by seeing which teams it compares to in attendance and viewership. In other words, if the leagues grow, we should see them comparing favorably to increasingly larger and more popular programs.
Note: USFL attendance figures are not currently available.
Overall comparisons
- The higher-end of Spring football game ratings were about on par with Texas A&M, UCLA, Ole Miss games, etc.
- The lower-end games are on par with those featuring Central Michigan, Georgia Southern, Memphis, Nevada, etc.
- In attendance they are about comparable to some MAC, C-USA, or Mountain-West teams.
The St. Louis Battlehawks and the Cincinnati Bearcats are almost perfect comps. Cincinnati averaged around 653,000 viewers and about 38,117 in attendance.
We’ll see how the proposed merger affects all of these stats in the coming year. Be sure to follow me and the XFL Insider Podcast on X at Pr0fD3Cull and The XFL Insider Podcast.
Sources:
- https://www.musclesportmag.com/2023/02/22/xfl-usfl-attendance-tv-ratings/?fbclid=IwAR21tYw7LYMSumxsBMWnjo26urK-9BSCwQBhz9B3CTIHd14aqxbluhM-2qY
- https://usflnewshub.com/usfl-news/usfl-2023-divisional-playoff-tv-ratings-report-on-fox-and-nbc/
- https://today.yougov.com/ratings/travel/popularity/cities/all
- https://medium.com/run-it-back-with-zach/which-college-football-programs-were-the-most-watched-in-2022-94eca4f6acbd
- https://www.macrotrends.net/cities/largest-cities-by-population
- https://www.sportsmediawatch.com/college-football-tv-ratings/
- https://www.sportico.com/business/media/2023/nfl-tv-ratings-report-cbs-fox-nbc-1234701217/
- https://www.d1ticker.com/2022-fbs-attendance-trends/
Responses